You pick up a story, write the code, write the unit tests and watch the suite go green. Edge cases pass, the PR merges, and you move on to the next task.
Three days later, your alerts start firing. The application hasn’t crashed, but your logs are bleeding noise: a cascade of NullReferenceException entries in Elastic and Application Insights every time an external call returns empty.
In an era where developers are able to utilise agentic coding to churn out working code in seconds, we’ve largely solved the syntax problem only to worsen the operational one. Both AI and good developers can write code that functions, but rarely code that observes.
I’m no perfect developer myself, and have fallen into this trap plenty of times. Revisiting code I wrote a few weeks prior because of a now obvious oversight is something we can all sympathise to.
When working day-to-day across multi-layered solutions - perhaps a .NET website tethered to an Umbraco CMS, backed by Redis, databases and external third-party services - “it runs on my machine” only validates an isolated happy path. Localhost gives your application the best case scenario: low-latency connections to caches, databases and empty log buffers masking debt that production exposes.
Enter Aspire.
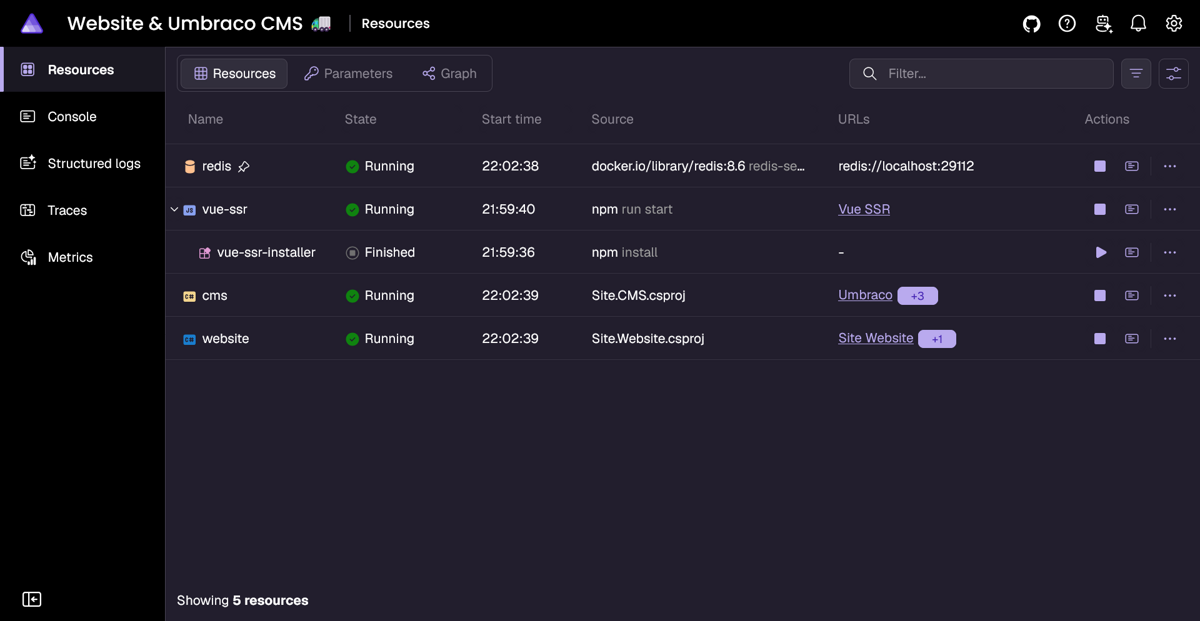
Most documentation or blogs write about Aspire as the perfect framework for new projects, the way for every developer to aspire to orchestrate their application; however, it’s been incredibly powerful to hook into existing website solutions to gain a deeper understanding into why an endpoint stutters, why a CMS lookup stalls, or which database call is silently running multiple times per page request after a cache miss.
It’s amazingly easy to setup, as well. I often find myself using the Aspireify skill to allow my agent to tie the application together, all with first class OpenTelemetry support.
Lets take a look at an example.
You have a registration form: it accepts user details, stores them in Azure Blob Storage, and makes a request to an external CRM system to create the new contact in the system. QA flag that the form takes 10 seconds to submit - strange.
Traditionally, you may have thought to start the application locally, set a breakpoint, and step through your code line-by-line, waiting for an exception to throw or some asynchronous call to hang. You have no timings, of course, so might drop in a temporary stopwatch around code you suspect might be the problem. Of course, you often step back in code to rerun a call, as you weren’t sure if your IDE caused a slowdown, or if there was a legitimate problem.
With Aspire? You just run it. Through OpenTelemetry metrics collated into the dashboard, you can gain an immediate insight into the problematic code: